
A method built to finish projects on time.
KairoProject is built on Critical Chain Project Management (CCPM) — an approach that puts deadline protection and decision clarity at the heart of project steering.
Critical chain identified automatically
Protection buffer calculated and tracked
Fever Chart to act before it's too late
Portfolio visibility at a glance
Why projects drift
Most delays do not come from a lack of work. They come from a poor reading of the project.
Teams work on too many topics at once. Critical resources are scattered. Safety margins are hidden inside each task rather than pooled. And when a problem becomes visible, it is already too late to act easily.
The real problem
Parkinson's Law is real: work expands to fill the time available. The student syndrome is too: tasks start at the last moment. These two biases combined consume the safety margin before the project is even in trouble.
The Critical Chain method (Critical Chain Project Management, or CCPM) was developed specifically to address this problem.
The core principles of CCPM
CCPM is a project management method derived from the Theory of Constraints, developed by Eliyahu M. Goldratt in the 1990s.
It rests on four simple ideas.

Identify the real constraint

Pool the safety margins

Limit multitasking
Steer by the buffer
How KairoProject applies CCPM
KairoProject integrates these principles into a continuous planning and steering engine.
The critical chain
When you build a project in KairoProject, the engine automatically calculates the critical chain: the sequence of tasks that truly determines project completion, once resource constraints are taken into account.
Tasks on the critical chain are visually identified in the Gantt. These are the ones that must be protected first.
The protection buffer
Based on the variability of critical tasks, KairoProject calculates a recommended buffer — a time reserve positioned at the end of the critical chain.
This buffer is not an arbitrary margin. It is sized to absorb real uncertainty while remaining realistic.
Once the project is launched, the reference buffer is locked. KairoProject tracks its consumption in real time throughout execution.
What this changes
Your teams no longer need to defend individual task dates. They can focus on speed of progress. The buffer absorbs unexpected events — not each resource individually.
The Fever Chart
The Fever Chart is the central dashboard of the method.
It compares two pieces of information:
- the percentage of critical chain completed;
- the percentage of buffer consumed.
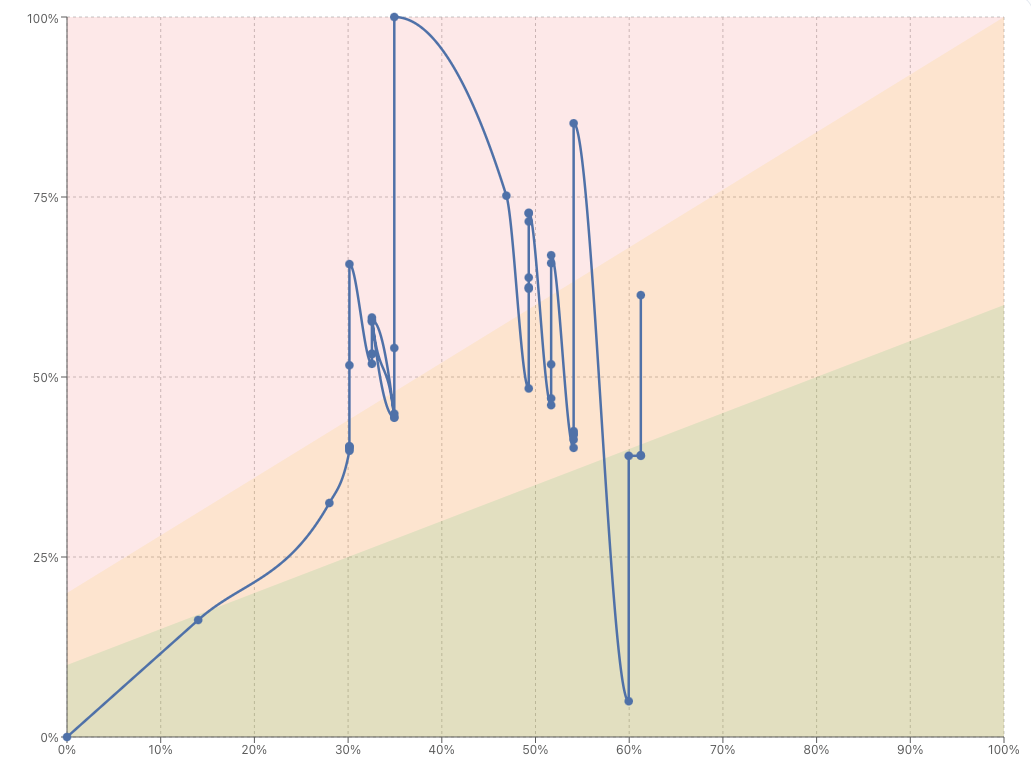
Three zones structure the reading:
| Zone | Color | Meaning |
|---|---|---|
| Healthy progress | Green | Buffer is consumed slower than the project advances |
| Attention | Yellow | Buffer consumption matches progress — no margin left. Anticipate an action plan. |
| Alert | Red | Buffer is consumed too fast — corrective action required. Apply the action plan. |
This chart enables decisions without delay. It gives an objective reading of the project's actual tension, without getting lost in the details of each individual task.
Resource management
CCPM is not just a schedule. It integrates resources from the planning phase onward.
See conflicts before they drift
KairoProject accounts for each resource's actual availability when calculating the schedule.
When two tasks require the same resource at the same time, the engine resolves the conflict by giving priority to the critical chain. Other tasks are shifted — not removed, but repositioned to avoid forced multitasking.
This logic produces a more realistic schedule from the start.

The resource load view shows available capacity, planned load, and tension levels per resource or per team.
For each resource, KairoProject calculates:
- available capacity based on their working calendar;
- planned load from scheduled tasks;
- overload periods;
- a tension score (bottleneck score) to surface constraints.
This information makes it possible to see not just who is overloaded, but on which project and why.
Portfolio visibility
A single project managed in isolation can appear healthy. But in a portfolio, comparing projects reveals the real tensions.
Steer the portfolio, not just the projects
KairoProject offers a portfolio view that ranks projects by their actual tension level, calculated from the ratio between their progress and buffer consumption.
A project that advances little but burns through its buffer quickly rises in priority automatically — even if no one has flagged it.
This logic avoids steering by noise, immediate urgency, or political pressure.

The portfolio pipeline visually compares projects by their buffer/progress tension level.
Two scheduling modes
KairoProject supports two planning logics to adapt to each project's context.
- 1ASAP (As Soon As Possible): tasks are pushed forward as early as their dependencies and resources allow. The buffer is added at the end. This mode is best when the goal is to finish as early as possible.
- 2ALAP (As Late As Possible): the schedule is pulled backward from the target completion date. Tasks start as late as possible without threatening the deadline. This mode is best when the completion date is contractual or externally imposed.
What this method changes in practice
CCPM is not a theoretical approach. It delivers concrete results across very different contexts: engineering firms, healthcare organizations, production workshops, service companies.
Fewer delays

Better resource use

Faster decisions
Frequently asked questions
CCPM is a project management method derived from the Theory of Constraints. It identifies the sequence of tasks that truly determines project completion, accounting for both task dependencies and available resources, then protects that sequence with a shared time buffer.
The traditional critical path does not account for resource constraints. Critical Chain integrates actual resource availability into schedule calculation, making the plan more realistic and more resilient to uncertainty.
In practice, CCPM avoids two very common problems:
- theoretically correct schedules that are impossible to hold because a resource is over-allocated;
- safety margins hidden inside each task, consumed before the project is even in trouble.
The buffer is a time reserve placed at the end of the critical chain. It protects the project completion date by absorbing unexpected events. KairoProject calculates this buffer automatically based on the variability of critical tasks, and tracks its consumption in real time to alert you early when the project drifts.
The Fever Chart is the central steering dashboard of CCPM. It compares project progress against buffer consumption. A green zone means the project is healthy, yellow calls for attention, red requires immediate corrective action.
It is the most useful indicator for steering without getting lost in the details: it gives a reading of the project's health, not just its state.
Yes. KairoProject offers a portfolio view that compares your projects by their actual tension — the ratio between progress and buffer consumption — to help you decide which one to protect first. This visibility is especially useful when several projects share the same resources.
No. KairoProject applies CCPM principles transparently. The engine calculates the critical chain, the buffer, and priorities automatically. Users benefit from the method without needing to master its mathematical details. The views are designed so that any project manager can read the situation and act quickly.
Sources and further reading
- Eliyahu M. Goldratt, Critical Chain (1997) — the founding work of the method, formalizing the concepts of constrained resource and project buffer.
- Lawrence P. Leach, Critical Chain Project Management (Artech House, 2004) — compiles real-world case studies (Lucent Technologies, US Navy, Intel) documenting on-time delivery rates between 80% and 95% after CCPM deployment.
- Lawrence P. Leach, "Critical chain project management improves project performance", Project Management Journal, Vol. 30(4), 1999 — first peer-reviewed empirical article on measured CCPM outcomes.
- Standish Group, CHAOS Report — reference report on IT project success rates. Successive editions (2015–2023) document on-time, on-budget delivery rates below 36% with traditional methods. standishgroup.com
- Project Management Institute, Pulse of the Profession — annual report on project performance across organizations. pmi.org
2 minutes · personalized result