Why Your Gantt Chart Becomes Unreliable the Moment Your Projects Share the Same Resources
Gantt charts work well for isolated projects. They become misleading the moment multiple projects compete for the same people. Here is why, and what to look at instead.
The schedule looked fine
The schedule was clean. Tasks were clearly broken down, dependencies mapped, durations estimated with care. The project manager had spent real time on it.
Three weeks later, the project was two weeks behind.
Not because of a gross error. Not because of a major unforeseen event. But because the lead developer was also on Project B. Because the designer had an urgent delivery for Project C. Because the subject matter expert, needed to validate a key milestone, was travelling for Project D.
The schedule was correct within its own scope. It was blind to everything around it.
That is the fundamental limitation of the Gantt chart in a multi-project environment: it describes a project as if it exists alone in the world.
Gantt charts work well — until projects start competing
Precision matters here, because the nuance is important.
A Gantt chart is a sequential planning tool. It represents tasks over time, their dependencies, their durations. For an isolated project with dedicated resources, it does exactly what it should: it gives a clear picture of what needs to be done, in what order, and over what period.
It is not a bad tool. It is a tool designed for a specific context — and that context is increasingly disconnected from how modern organisations actually work.
Today, most teams manage several projects simultaneously, with the same people. An engineering firm, an IT department, a consulting practice, a product team — their resources are not assigned to a single project. They constantly navigate between multiple priorities, multiple project managers, multiple deadlines.
In that context, the individual Gantt chart of each project remains technically coherent. But the system as a whole becomes structurally fragile.
The real problem is not the timeline
When a project slips, the instinctive reaction is to look for the error in the schedule itself: a badly estimated duration, a missed dependency, an unidentified risk.
Sometimes that is true. But in multi-project environments, the most common root cause is not in the schedule — it is in what the schedule does not show.
What an individual project Gantt chart does not show:
- The simultaneous workload of each resource across all other projects
- Priority conflicts between project managers competing for the same person
- The knock-on effect of a delay in Project A on resource availability for Project B
- Forced multitasking and the time lost in context transitions
These elements are invisible in a project Gantt chart. Yet they are the primary cause of delays in most organisations running multiple projects in parallel.
The correct schedule paradox
A schedule can be technically perfect — consistent durations, clean dependencies — and still produce significant delays. Not because it is wrong, but because it is incomplete: it describes one project as though it were the only one that exists.
Shared resources change everything
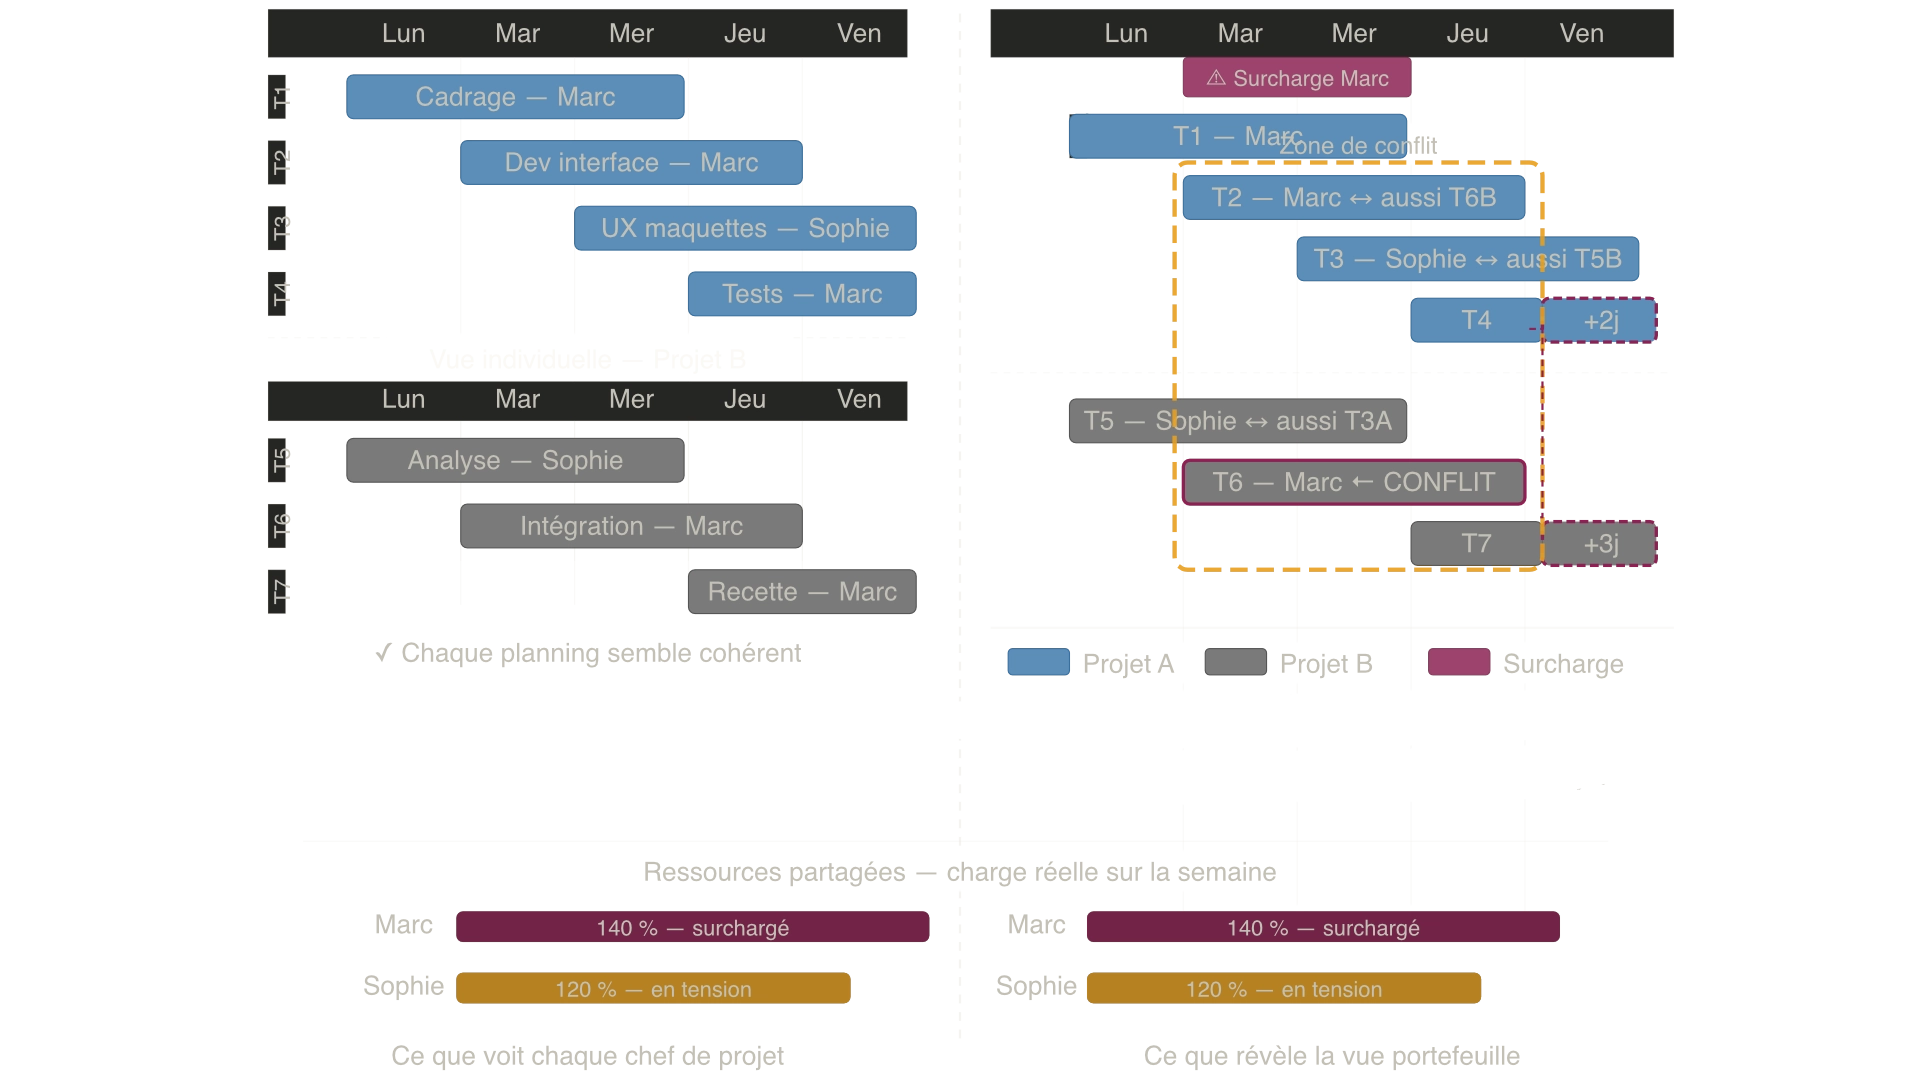
Here is a concrete example to make the problem tangible.
Project A: redesign of a client interface. Estimated duration: 8 weeks. Project B: integration of a new ERP module. Estimated duration: 10 weeks.
Both projects start at the same time. They share three key resources:
- The senior developer (Mark): allocated at 60% to A, 40% to B in the respective schedules.
- The UX designer (Sophie): allocated at 50% to A, 50% to B.
- The subject matter expert (Julian): required for validation on both A and B, supposedly available on demand.
On paper, both Gantt charts are coherent. Each project manager has planned accounting for partial resource availability.
What the Gantt charts do not show:
In week 3, Project B falls behind on a critical task. The Project B manager pulls Mark to 80% to catch up. Mark is still shown at 60% on Project A's Gantt — but in reality, he is overloaded. He works on both in a degraded mode.
In week 4, Sophie needs to deliver two sets of mockups simultaneously for A and B. She produces both, but in twice the expected time — because she spends half her energy managing the context shifts between two entirely different visual environments.
In week 5, Julian is travelling for a client. Both projects are waiting for his validation. Neither project manager had planned for this in their Gantt — because each assumed he would be "available when needed."
By week 8, Project A is 3 weeks late. Project B is 4 weeks late. Both initial Gantt charts were correct. The reality of the system was never visible.
Why multitasking destroys planning reliability
Multitasking is one of the most underestimated schedule killers in project management.
When a resource switches between two tasks or two projects, they do not produce the sum of both. They produce less — because every context transition carries a real cost: time spent getting back up to speed, retrieving the right mental state, re-reading what had been done.
This transition cost — called context switching in the productivity literature — is difficult to quantify precisely, but its effects are well documented. A resource alternating between two complex tasks can lose 20 to 40% of their effective work time in transitions alone.
What this means for the schedule:
A task estimated at 5 days for a dedicated resource may take 8 to 9 days if that resource is forced into multitasking. The Gantt shows 5 days. Reality delivers 8 or 9.
And because multi-project schedules are built sequentially — the next task starts when the previous one ends — this initial slip propagates across every downstream task. A 3-day delay on one task can translate into 2 weeks of shift on the end date.
The hidden costs that Gantt charts do not account for
Beyond multitasking, multi-project environments generate invisible costs that appear in no Gantt chart.
Waiting time
When a resource is occupied on another project, the tasks that depend on them wait. This waiting time is not planned — it inserts itself into the timeline without being visible, extending the real duration of the project without anyone having anticipated it.
Priority confusion
In a multi-project environment without explicit arbitration, resources receive simultaneous requests from multiple project managers. Without a clear priority at the portfolio level, they make the call themselves — usually based on whoever is applying the most pressure at that moment, not on strategic importance.
The result: the loudest projects move forward, the others wait. This is not a management decision — it is an absence of decision that manifests as a default outcome.
Local optimisation
Each project manager optimises their own project. That is rational at their level. But this local optimisation can degrade the overall system: mobilising a critical resource to advance a low-priority project at the expense of a strategic one.
Invisible bottlenecks
In a project portfolio, some resources are systemic constraints: they limit the throughput of the entire operation. A rare expert, an undersized team, an unavoidable approver. If nobody has a view on these resources' load across the portfolio, the bottleneck remains invisible — and continues to slow every project that depends on it.
What the Gantt shows
What the Gantt does not show
The planning is static, but the system is dynamic
A Gantt chart is a photograph. It captures a reality at a given moment: available resources, estimated durations, known dependencies.
But a project portfolio is a living system. Resource availability changes. Priorities shift. Tasks take longer than expected. New projects arrive mid-flight and compete for the same resources.
The Gantt does not update itself automatically to reflect these realities. It remains the original photograph — increasingly disconnected from what is actually happening.
The problem with manual updates
In organisations managing many projects, keeping Gantt charts up to date is a task in itself. And often, this updating is incomplete, delayed, or abandoned under the pressure of daily operations. The displayed schedules no longer reflect reality — but decisions continue to be made based on them.
This may be the most serious limitation of all: not that the Gantt is structurally wrong, but that it is structurally behind reality in dynamic environments.
Why delays propagate faster in multi-project environments
In an isolated project, a task delay can be absorbed: another task is adjusted, the schedule is replanned, the impact is managed locally.
In a multi-project environment with shared resources, the same delay has a multiplier effect.
The propagation mechanism:
- Task T1 on Project A runs 3 days late.
- Resource R, who was due to start T2 on Project B after completing T1, is now delayed by 3 days.
- T2 on B feeds into T3 on B, which feeds into T4 on B — the delay propagates downstream.
- Meanwhile, R was also expected to start T5 on Project C the following week — that project is now delayed before its critical phase has even begun.
This is not an exceptional scenario. It is the normal dynamic of a shared-resource project portfolio without an explicit protection or prioritisation mechanism.
And this propagation is invisible in individual Gantt charts — because each Gantt only sees one project at a time.
What project managers actually need to see
Having described what breaks, the useful question is: what does an operational manager, a PMO, or a senior leader actually need to see to run a project portfolio?
The real workload of key resources
Not their theoretical allocation project by project, but their consolidated load across the entire portfolio. Who is overloaded? Who has capacity? Which resource is the constraint that is slowing everything else down?
Explicit priorities between projects
When a resource cannot do everything at once, a decision must be made about which project goes first. That decision cannot be left to the resource themselves, and cannot default to whichever project manager applies the most pressure. It must be a management decision — explicit and known by everyone.
The overall health of the portfolio, not the status of each task
In a portfolio of eight projects, no one can track the progress of every task. What decision-makers need is a synthetic read: which projects are healthy, which are under pressure, where does the risk concentrate.
Early warning signals — before the delay materialises
Most project reporting systems flag delays once they have already occurred. What is needed is the ability to see them coming: a resource approaching overload, a buffer being consumed faster than the project is progressing, a critical task that has been waiting too long.
A better approach: priorities, constraints and flow
The point here is not to propose a magic method. The complexity of multi-project environments does not disappear by changing a tool or a framework.
But there are approaches that were specifically designed for this context — and that directly address the blind spots of individual Gantt charts.
Think in constraints, not in tasks
Critical Chain Project Management (CCPM) starts from a different premise: rather than planning all tasks in parallel and hoping resources will keep up, it first identifies the constraint — the resource or sequence of tasks that truly determines the project duration — and builds the schedule around it.
In a multi-project environment, this also means identifying the bottleneck resource at the portfolio level: what is the single constraint that limits the throughput of the whole system?
Protect flow, not individual dates
In a classical approach, the focus is on whether each task meets its date. In a flow-oriented approach, the focus is on whether the constraint is advancing — and whether the safety margin (the buffer) is being consumed proportionally to progress.
This is the principle behind the fever chart: a simple indicator that synthesises the health of a project in two variables — progress and buffer consumption — rather than in hundreds of lines of Gantt.
Set explicit priority at the portfolio level
Priority between projects cannot be implicit in a multi-project environment. It must be visible, known to all resources, and stable — or at least coherent in how it changes.
Without explicit priority, resources arbitrate themselves. And their arbitration, rational at their level, may be incoherent at the portfolio level.
Limit the number of simultaneously active projects
One of the most counter-intuitive insights in modern project management: launching fewer projects at the same time often delivers all of them faster.
When the portfolio is overloaded, all resources are in multitasking, all projects advance slowly, and none finish on time. By limiting the number of active projects to the real capacity of the system — particularly the capacity of the bottleneck resource — projects in progress advance faster, and waiting projects start in better conditions.
If your organization still stacks Excel, a Gantt chart, and Jira with no shared priority between projects, this article walks through switching to priority-based steering gradually, without rebuilding your entire toolset at once.
When Gantt charts still make sense
This analysis should not be read as a condemnation of the Gantt chart. That would be both inaccurate and unhelpful.
The Gantt chart remains a relevant and effective tool in several contexts:
Projects with dedicated resources. When a team is fully assigned to a single project for its duration, the Gantt accurately reflects reality. Cross-project resource conflicts do not exist.
Scoping and communication phases. To present the structure of a project, communicate about the sequence of deliverables, or align stakeholders on major phases, the Gantt is an effective communication tool that is universally understood.
Short, sequential projects. On projects lasting 2 to 4 weeks with a stable team, the multi-project dynamic does not have time to produce its effects. The Gantt is sufficient.
Initial planning support. Before thinking about resources and constraints, structuring the logic of a project — which tasks, in what order, with what dependencies — is a necessary step. The Gantt is a well-adapted tool for this.
The limitation is not in the tool itself. It is in using it as the sole management instrument in environments for which it was not designed.
What this concretely changes
| Situation | With individual Gantt charts | With portfolio-level visibility |
|---|---|---|
| Two projects share the same resource | Conflict invisible in each Gantt | Conflict visible, arbitration possible |
| A resource is multitasking | Undetected, durations underestimated | Overload visible, prioritisation possible |
| A project falls behind | Impact on other projects invisible | Propagation detectable in advance |
| Priority between projects | Implicit, arbitrated by resources | Explicit, decided by management |
| Overall portfolio health | Task-by-task reading | Synthetic view at a glance |
| Bottleneck identification | Invisible | Visible and actionable |
Frequently asked questions
No. Gantt charts remain a relevant planning tool for isolated projects, dedicated resources, or scoping and communication phases. They become structurally unreliable in multi-project environments where several projects share the same people — not because they are poorly designed, but because they were designed for a different context.
Partially. A Gantt that displays several projects simultaneously allows you to visualise overlaps. But it does not solve the underlying issue: it shows what is planned, not what is possible. Without resource constraint modelling and an explicit prioritisation mechanism, a multi-project Gantt remains a static view of a dynamic system.
Mainly because they are built on resource availability assumptions that do not hold in multi-project reality. Multitasking, unplanned waiting, priority conflicts, and delay propagation between projects create a growing gap between the planned schedule and lived reality — often without anyone being responsible for a specific mistake.
Resource conflicts arise when the same person, team, or skill set is assigned to multiple parallel tasks across several projects. Without consolidated visibility into workload at the portfolio level, each project manager plans as if the resource were fully available to them — creating real overloads that are invisible in each individual schedule.
Critical Chain Project Management (CCPM) was specifically designed for this context. It identifies the real constraint in the system, builds the schedule around that constraint, and protects the end date through a buffer managed in real time — rather than hidden safety margins embedded in each individual task. It comes with portfolio visibility tools — such as the fever chart — that provide a synthetic read of the health of the entire project set.
Yes. CCPM incorporates the dependency structure logic of a Gantt chart, but extends it with resource modelling, critical chain identification, and buffer management. In practice, the Gantt structure serves the initial planning phase; the critical chain and fever chart take over for execution-phase management.
Read next
Your schedule may be perfectly correct — and your project will still be late
Critical chain and critical path look similar but drive very different project realities. Understanding the difference changes how you manage projects for good.
How to Prioritize Multiple Projects with Shared Resources
When an engineering firm runs several projects with the same team, project-by-project prioritization breaks down. A clear method to make decisions based on real signals.
Why Projects Are Always Late
Projects are usually delayed because of inaccurate estimates, multitasking, and resource conflicts. Here is why these mechanisms appear — and how to fix them.
Excel, Gantt, Jira… and Still Late: What Changes When You Steer by Priority
Your team juggles Excel, a Gantt chart, and Jira but sprints still slip? Here's what actually changes when you steer a project portfolio by priority instead of by tool.