How to Prioritize Multiple Projects with Shared Resources
When an engineering firm runs several projects with the same team, project-by-project prioritization breaks down. A clear method to make decisions based on real signals.
Monday morning. Three active projects. One engineering team stretched across all of them. And nobody really knows which one should come first.
This is not a motivation problem or a competence problem. It is a method problem: when resources are shared, you cannot prioritize project by project — let alone task by task. You need an objective criterion. And that criterion must come from data, not from intuition or from whoever speaks the loudest.
This article explains why classic prioritization fails in this context, which signals to read, and how to structure a reliable arbitration decision.
Why Classic Prioritization Fails in Multi-Project Environments
In an engineering firm, the usual tools — Gantt charts, task lists, shared spreadsheets — share one common limitation: they reason project by project.
Each project manager defends their own progress. Each dashboard shows its own delays. But none of these tools answer the real question: among all ongoing projects, which one deserves the team's attention right now?
When a project falls behind, the typical response is to call a meeting, confirm that everyone is overloaded, and then let the director make a gut-call decision. Sometimes that decision goes as far as sacrificing one project to free up resources for the others — when the right data might have shown that a simple reallocation could save both.
The problem is not a lack of willingness to decide. It is the absence of a shared reading framework.
The Real Problem: Shared Resources Create Invisible Dependencies
In an engineering firm, the same engineers, technicians, and project leads work across several projects at once. An architecture practice may run three renovation projects in parallel, all depending on the same technical lead. An electrical engineering firm may have the same design team working on four tenders simultaneously.
The shared resource paradox
A resource fully allocated to a secondary project blocks progress on all priority projects — without anyone seeing it in a classic schedule.
This is where the real problem lies: an "urgent" task in a low-priority project can absorb a key resource at the expense of a project with far heavier contractual consequences.
Classic tools list tasks and draw Gantt charts. But they rarely show the real constraints: who is overloaded, on which project, and what impact that has on the rest of the portfolio.
The Three Signals to Read Before Deciding
Before making a prioritization decision, three combined signals must be read.
1. Buffer Consumption
The buffer is a project's safety margin. If a project is consuming its margin too fast relative to its progress, it is under real pressure — not just perceived pressure.
A project at 60% progress that has already consumed 80% of its buffer is in danger. A project at 40% progress with 30% buffer consumed is still in a safe zone.
2. Progress Compared to Buffer Consumed
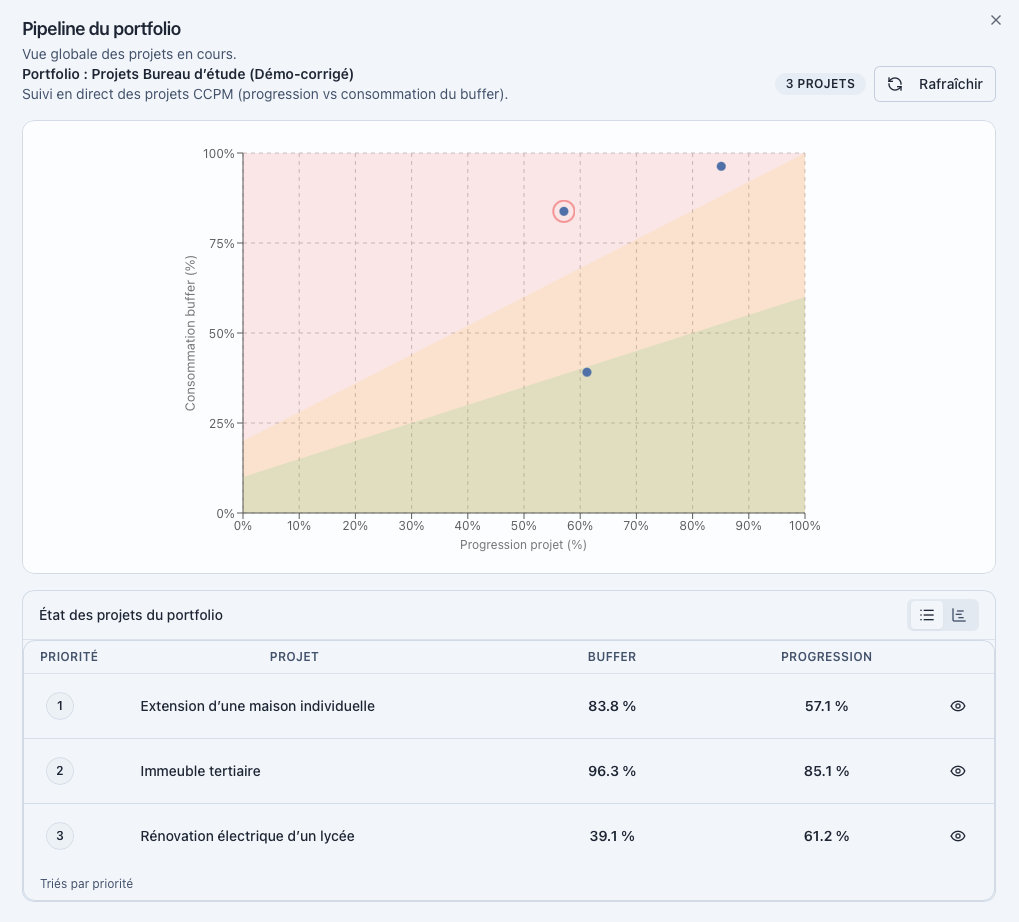
This ratio — actual progress versus consumed protection — is the most reliable signal for detecting a drifting project. This is what the Fever Chart represents: a visual reading of the real tension of each project in the portfolio.
3. The Load on the Constrained Team
Which profile is overloaded? On which project? For how long? An overloaded resource is often the true portfolio bottleneck — and moving it from one project to another is the most effective arbitration decision a director can make. When that overload becomes chronic rather than situational, see how to detect and fix resource overload.
Buffer consumed
Progress vs protection
Constrained resource
A 5-Step Method for Arbitration
- 1List all active projects in the portfolio with their current progress status
- 2Identify resources shared across multiple projects
- 3Spot the projects consuming their buffer fastest relative to their progress
- 4Identify the resource or team that constitutes the portfolio bottleneck
- 5Explicitly decide which project comes first — and communicate that decision to the team
This method does not require hours of meetings. It requires the right indicators, readable at a glance. For a concrete resource-allocation method once priorities are set, see how to allocate resources across multiple projects.
Concrete Example: Three Projects, One Shared Design Team
Consider an electrical engineering firm managing three projects simultaneously:
- Project A — Electrical renovation of an office building, contractual deadline in 6 weeks
- Project B — Feasibility study for an industrial building, file submission in 10 weeks
- Project C — Standards compliance for a large retail facility, study phase ongoing, flexible deadline
The design team — two engineers and a technical lead — works across all three projects.
What a classic tool shows: Project C generates the most requests and meetings. It is "visible." The Project C manager is the most present. The team naturally spends more time on it.
What the data shows:
| Project | Progress | Buffer consumed | Team load |
|---|---|---|---|
| Project A | 55% | 78% | Under-allocated |
| Project B | 40% | 35% | Adequate |
| Project C | 30% | 25% | Over-allocated |
Project A is under the most real pressure: it has consumed 78% of its buffer for only 55% progress, with a contractual deadline approaching. Yet the team is under-allocated on it because Project C is absorbing attention.
The right decision is not to sacrifice a project. It is to reallocate part of the design team's capacity from Project C to Project A — and to do it now, not in three weeks when the delay has become irreversible.
What Classic Tools Usually Miss
A Gantt chart shows tasks and dates. A Kanban board shows statuses. A shared spreadsheet shows whatever each person chose to enter.
None of these tools answer the question: which project deserves the team's attention today, and why?
They do not automatically cross-reference progress, buffer, and resource load. They do not synthesize these three signals into an action recommendation. And above all, they do not show the dependencies between projects — what a decision on Project C actually means for Project A.
The cost of deciding without data
Sacrificing a project to free up resources is sometimes the right call. But made without data, it is an irreversible decision based on intuition. With the right indicators, a simple reallocation is often enough.
How Critical Chain Changes Prioritization
Critical Chain Project Management (CCPM) is built on a simple principle: a project is not a list of tasks, it is a flow. That flow is limited by constraints — shared resources, task dependencies, bottlenecks.
The critical chain is the sequence of tasks that actually determines project duration, accounting for both logical dependencies and available resources. It is not necessarily the longest path on paper — it is the path that integrates real field constraints.
The buffer protects this chain. It absorbs uncertainty without jeopardizing the delivery date. And it is buffer consumption — not the number of late tasks — that signals whether a project is truly drifting.
Across a multi-project portfolio, CCPM allows projects to be ranked by real tension, not by visibility or meeting volume.
Learn more about Critical Chain Project Management
How KairoProject Helps
KairoProject applies these principles operationally. From the moment of login, the director or portfolio manager sees three immediate blocks:
- Which project is the priority — and why, based on the three combined signals
- Which action is recommended — with a direct action button, no prior analysis required
- Which resource is constrained — and which project it should focus on
This is not a dashboard to interpret. It is an analytical synthesis that leads directly to a decision.
The portfolio view compares the real-time progress and buffer consumption of each project. The Fever Chart positions each project in a green, orange, or red zone. The resource load view identifies overloaded teams and under-resourced projects.
Frequently Asked Questions
This article is part of our complete guide to managing multiple projects with a shared team — practical guides for managing multiple projects with the same teams, without sacrificing either.
Read next
The CCPM Fever Chart: The Only Graph That Tells You Where Your Project Really Stands
The CCPM fever chart turns project progress into an immediate decision signal. Learn how to read it, interpret each zone, and use it to manage your portfolio.
Why Your Gantt Chart Becomes Unreliable the Moment Your Projects Share the Same Resources
Gantt charts work well for isolated projects. They become misleading the moment multiple projects compete for the same people. Here is why, and what to look at instead.
How to Manage Multiple Projects at Once with a Shared Team
When the same team works on several projects simultaneously, everyone is busy but nothing really moves forward. Here is the concrete method to take back control.